This is the first of a three-part series covering analyses that were part of the Energy Transition Initiatives Partnership Project which was a Department of Energy funded program in the form of technical assistance for the County of Kauai.
Travel Pattern Analyses Using App-Based Cellphone Data Report Summary –
Researchers at National Renewable Energy Laboratory (NREL) and Lawrence Berkeley National Laboratory (LBNL) working with the Energy Transitions Initiative Partnership Project (ETIPP) were commissioned to assess the feasible application of emerging transportation technologies on Kauai. The findings were published in three separate studies, which together offer a full understanding of the scope. Studies covered mobility data, travel pattern analysis and emerging transportation technology, and a fast charger network.
Regarding travel pattern analyses, this post will summarize the data and methods used to inform and measure infrastructure demand and mobility options. The data used in this study primarily consists of app-based cellphone data provided from consumer insights platform Near.com, which provided GPS points from over a combined 100,000 resident and visitor smartphone devices across six seasonal periods ranging from 2019 to 2022. Each season was analyzed independently.
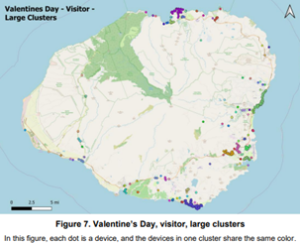
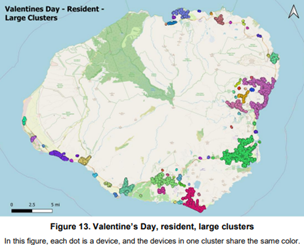
Travel hotspots are determined using the density-based spatial clustering of applications with noise (DBSCAN) clustering algorithm. Researchers confirmed that the cluster parameters used were sensible to local context. A cluster is defined as the number of data points close to each other; sub-clusters are defined as the number of clusters close to each other. Defined large clusters gave broader insight into seasonal and regional pattern differences, along with informing long-range mobility planning.
Datasets show the highest number of visitors during February (Valentine’s Day) and July, then the winter holiday season between December to January, followed by spring break and off-season between April to May. Resident activity largely remains the same, with only a slight dip during the winter holidays. Despite a fluctuation in cluster size across seasons and locations, large visitor clusters are consistently observed around commercial and lodging areas in Lihue, by Kauai Community College, Rice Street, Kapaa, and a portion of Highway 50 in Waimea, along with scenic lookouts. Activity is consistent across all seasons in Hanalei and Princeville. Small visitor clusters form at fast-food spots, restaurants and cafes, gas stations, markets and convenience stores, clothing and gift shops, hotels and beaches in these areas: Lihue Civic Center, Coconut Marketplace, Hanalei, Old Koloa Town. Seasonal resident hotspot patterns are similar to visitors’, apart from significant clusters in the southwest area of the island around Barking Sands Airport and Barking Sands Beach.
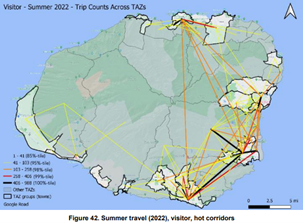
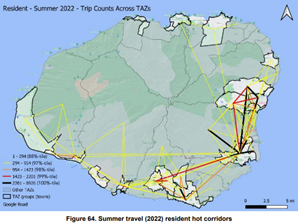
Trip distribution also informed transportation analysis zone (TAZ) groups in identifying heavily frequented travel corridors, which are routes to and from. Popular visitor corridors show up in the central Poipu area, regardless of season, followed by the Poipu-Lihue, Lihue-Princeville, Lihue-Hanalei corridors, and lastly, within and between Koloa, Poipu, Kapaa, Hanalei, and Princeville. Less frequented visitor corridors include Waimea and scenic lookout locations. Resident trip distribution is more evenly spread across corridors where residential, work, and commercial locations are found, with corridors occurring within and between Kekaha, Hanapepe, Kalaheo, Poipu, Kapaa, Kilauea, Princeville, and Hanalei. The highest number of resident trips cover the shopping areas in the Lihue area. Regardless of the season, Lihue is a central hub for visitors and residents alike.
The above findings provide insight into infrastructure planning for long and short-range mobility options, including, but not limited to bike and scooter share locations, car sharing, autonomous vehicle shuttles and transit routes. Additional data sources will be utilized in the final study to account for locations with weak cellphone signals that may be underrepresented.
For more information regarding the methodology, analyses, and findings, the published study can be found here – https://kauaiforward.com/wp-content/uploads/2024/09/ETIPP-Kauai-travel-pattern-report_final.pdf
-Clarissa Hsi, Climate Communications VISTA, Office of Economic Development, County of Kauai